Calgary Metropolitan Population Growth: By the Numbers (2016)
- July 28, 2017
- By Cody Battershill
Recent CMA Population Growth Statistics
You would have thought that Calgary’s population would have dropped given the province’s economic climate over the past few years. Nope!
The Calgary metropolitan census area (CMA) has managed to continue its spurt of population growth through to the end of 2016 with further growth projected when this year is over.
Below are some of the most recent population statistics for the CMA. You may ask, what defines a census metropolitan area anyways? Here is Statistics Canada’s definition:
A metropolitan area with a population of at least 100,000 people, where the urban core of such area has at least 50,000 people living in it. Census metropolitan areas do not go by conventional municipal boundaries.
By the Numbers
- 1,392,609 – the number of people living in the Calgary metropolitan census (CMA) area in 2016
- 14.6% - percentage of population increase over the most recent 5-year period of 2011 to 2016
- 11.6% - provincial average percentage of population increase over the same time frame above for census metropolitan areas
- 5.0% - national average percentage of population increase over the same time frame above for census metropolitan areas
- 13.0% - percentage of population increase for the City of Calgary alone between 2011 and 2016
- 1,239,220 – the number of people living in the City of Calgary alone in 2016
- 36.4 – median age of Calgarians in 2016
- 47.7% - estimated number of Calgarians who will stay between ages 25 and 54 over the next few years
- 135,070 – number of cats and dogs in City of Calgary in 2016
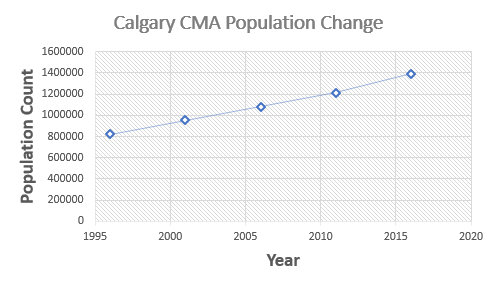
| Year | Population |
| 1996 | 822221 |
| 2001 | 951536 |
| 2006 | 1079310 |
| 2011 | 1214839 |
| 2016 | 1392609 |
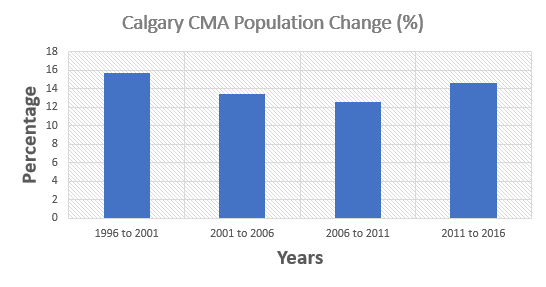
| Years | Pop. Change (%) |
| 1996 to 2001 | 15.7 |
| 2001 to 2006 | 13.4 |
| 2006 to 2011 | 12.6 |
| 2011 to 2016 | 14.6 |
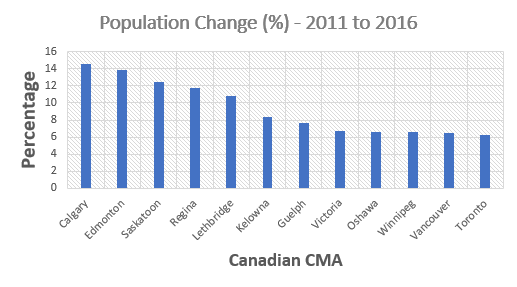
| Census Metropolitan Area | Population Change (%) - 2011 to 2016 |
| Calgary | 14.6 |
| Edmonton | 13.9 |
| Saskatoon | 12.5 |
| Regina | 11.8 |
| Lethbridge | 10.8 |
| Kelowna | 8.4 |
| Guelph | 7.7 |
| Victoria | 6.7 |
| Oshawa | 6.6 |
| Winnipeg | 6.6 |
| Vancouver | 6.5 |
| Toronto | 6.2 |
More Population-Related Statistics
- 519,693 – number of private dwellings occupied in the City of Calgary in 2016
- 12.0% - percentage increase of number of private dwellings in 2016 compared to 2011
- 5,110.21 – Calgary’s land area in square kilometres in 2016
- 272.5 – population density per square kilometre in 2016
*Sourced from Statistics Canada, Calgary Economic Development, City of Calgary
I Love Calgary
Do you love Calgary as much as we do? If so, we invite you to join tens of thousands of other locals at our online community of Calgaryism on Facebook and Instagram today. We hope to see you there!